
From traces to structured events
Signals are powered by our trace analysis agent. The Signals agent takes three inputs:- Trace: the agent run to analyze.
- Instruction: what to look for, in plain language.
- JSON schema: what to record when it finds a match.
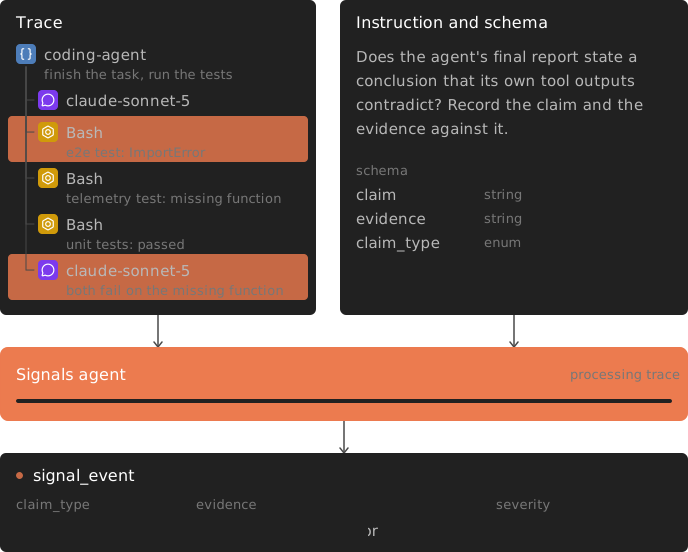
A coding agent's report contradicts its own test output, and the Signals agent records it as a structured event.
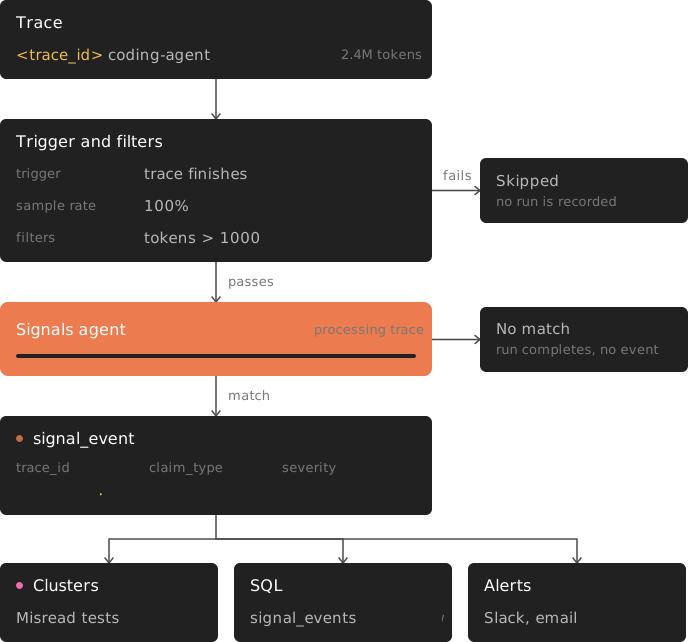
Each finished trace is checked against the Signal's trigger and filters, then read by the Signals agent. A matching trace produces an event that is grouped into a cluster, stored for SQL, and checked against your alerts.
Example: catch a report that contradicts its own evidence
In the trace above, a coding agent reports its work as done despite two failing tests. It blames both failures on the same pre-existing problem, but one test log shows a different error. Every tool call succeeded. The mistake is in the agent’s reasoning, and if you trust its report, you’ll look for the wrong bug. To find reports that contradict the agent’s own evidence, we created a Signal with the following instruction:Does the agent’s final report state a conclusion that its own tool outputs contradict? Record the claim and the evidence against it.The schema defines three fields:
claim: the statement in the final report.evidence: the tool output that contradicts it.claim_type: one ofroot_cause,completion,verification, orother.
claim_type across traces to see which kinds of claims our agent gets wrong most often.
Cost efficient and reliable analysis on every trace
To monitor an agent in production, trace analysis needs to be accurate enough to trust and cheap enough to run on every trace. Sampling leaves failures unseen, while noisy results make alerts hard to act on. Off-the-shelf models often force a tradeoff: cheaper models miss failures or flag problems the evidence doesn’t support, while more capable models make analyzing every trace too expensive at production scale. We trained flow-1 with reinforcement learning specifically for agent trace analysis to meet both requirements:- Quality: it matches GPT-6-sol in failure detection quality on our benchmark, while being 23x cheaper.
- Cost: It would cost just $3.5 on average to process 1k traces of 100k tokens each. Learn more about Signals pricing here, and cap your spend with usage warnings and hard limits.
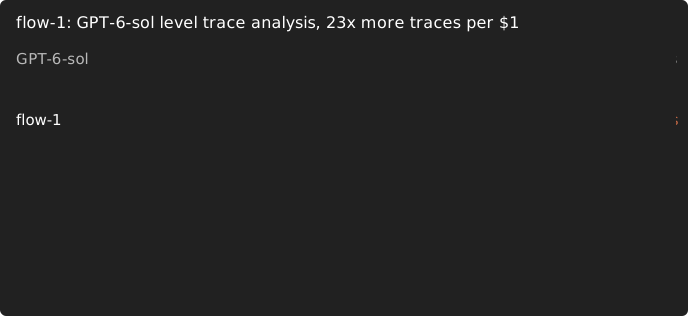
One dot per trace analyzed for $1.
Define your own trace analysis
Signals are a general way to analyze traces. You decide what to look for and what to record. An instruction can ask a broad question, combine several conditions, or compare evidence across different steps. The output schema gives you control over the fields and categories in the result. For example, you could ask a Signal to:- Detect a specific behavior: Did the agent promise a refund without calling the refund tool? Record the promise and the missing action.
- Classify a conversation: What was the user trying to accomplish, and was it resolved? Return an intent and an outcome.
- Extract information: Which integrations did the user ask for? Collect the integration names and the requests they made.
- Compare evidence: Do the amounts in the contract agree with the accompanying memo? Record any mismatches and where they appear.
Write the instruction
The instruction is not a full LLM prompt. The Signals agent already knows that it is analyzing a trace, how the trace is laid out, how to cite the spans behind a finding, and how to return an event in your schema, or no event when nothing matches. Your instruction only says what to look for. A general description is usually enough. These are complete instructions:Find runs where the agent gave up before completing the user’s request.
Did the agent promise a refund without calling the refund tool?
What was the user trying to accomplish? Classify the primary intent.Leave out what the Signals agent already handles:
- A role or persona. Don’t open with You are an expert judge evaluating AI agents. The agent’s role is fixed.
- How to read the trace. The trace format, span types, and long inputs and outputs are handled for you.
- The output format. Don’t ask for JSON or describe the response shape. Put the fields you want in the output schema, and use each field’s description to say what goes in it.
- When to stay quiet. A trace with no match already returns no event.
How Signals are billed
On Tracevell Cloud, Signals run on Tracevell’s own model, so you don’t bring a model API key. Every Signal run is billed by the tokens the Signals agent uses to read the trace and write its result (input, cached input, and output tokens).- What counts: every run, from live triggers and from backfills. A trace that doesn’t pass the Signal’s trigger, filters, or sample rate is skipped and costs nothing.
- Credit: every new workspace gets a one-time $5 Signals credit. On the Free plan, Signals stop when the credit is used up. Paid plans bill usage beyond the credit per token.
- Rates: per-token prices for each plan are on the pricing page.
- Control spend: filters and the sample rate decide how many traces each Signal analyzes. Track spend in Settings > Usage and cap it with usage warnings and hard limits.
Get started
If you’re new to Tracevell, start by sending your agent’s traces. Every new project includes a Failure Detector Signal. Open Signals in your project to inspect its findings. When you create your own Signal, review its findings on representative traces before relying on its alerts. The results are model judgments, and the linked evidence lets you check them.Quickstart
Create your first Signal and inspect its events.
CLI
Define and manage Signals from your terminal.
Clusters
Explore recurring patterns across traces.
Alerts
Get notified when a Signal finds an issue or a new event cluster forms.